Data Visualization in Genomics: Building Interactive Volcano Plots Using R Programming
Dr. Omics Edu Team · · Updated
Introduction
With the rapid advancement of next-generation sequencing (NGS), researchers now generate massive amounts of genomic and transcriptomic data in a single experiment. While statistical analysis identifies differentially expressed genes, interpreting thousands of data points can be challenging without effective visualization. This is where volcano plots become one of the most valuable tools in genomics. A volcano plot provides a simple yet powerful way to visualize genes that show significant expression changes between two biological conditions.
Today, R-programming for biology has become the preferred language for genomic data analysis because of its strong statistical capabilities and extensive visualization libraries. Combined with RStudio bioinformatics, researchers can easily perform differential expression analysis, generate publication-quality volcano plots, and explore genomic datasets interactively. This article introduces volcano plots, discusses their importance in transcriptomics, and explains how R simplifies genomic data visualization.
Why Data Visualization is Important in Genomics
Modern sequencing experiments often measure the expression of more than 20,000 genes simultaneously. Looking at raw spreadsheets filled with numbers makes it difficult to identify biologically meaningful patterns. Data visualization converts these complex datasets into easy-to-understand graphical representations.
Volcano plots help researchers quickly identify genes that are significantly upregulated or downregulated, making it easier to prioritize genes for downstream analyses such as pathway enrichment, biomarker discovery, or functional studies.
Visualization also improves communication of scientific results, making research findings easier to interpret for both scientists and non-specialists.
What is a Volcano Plot?
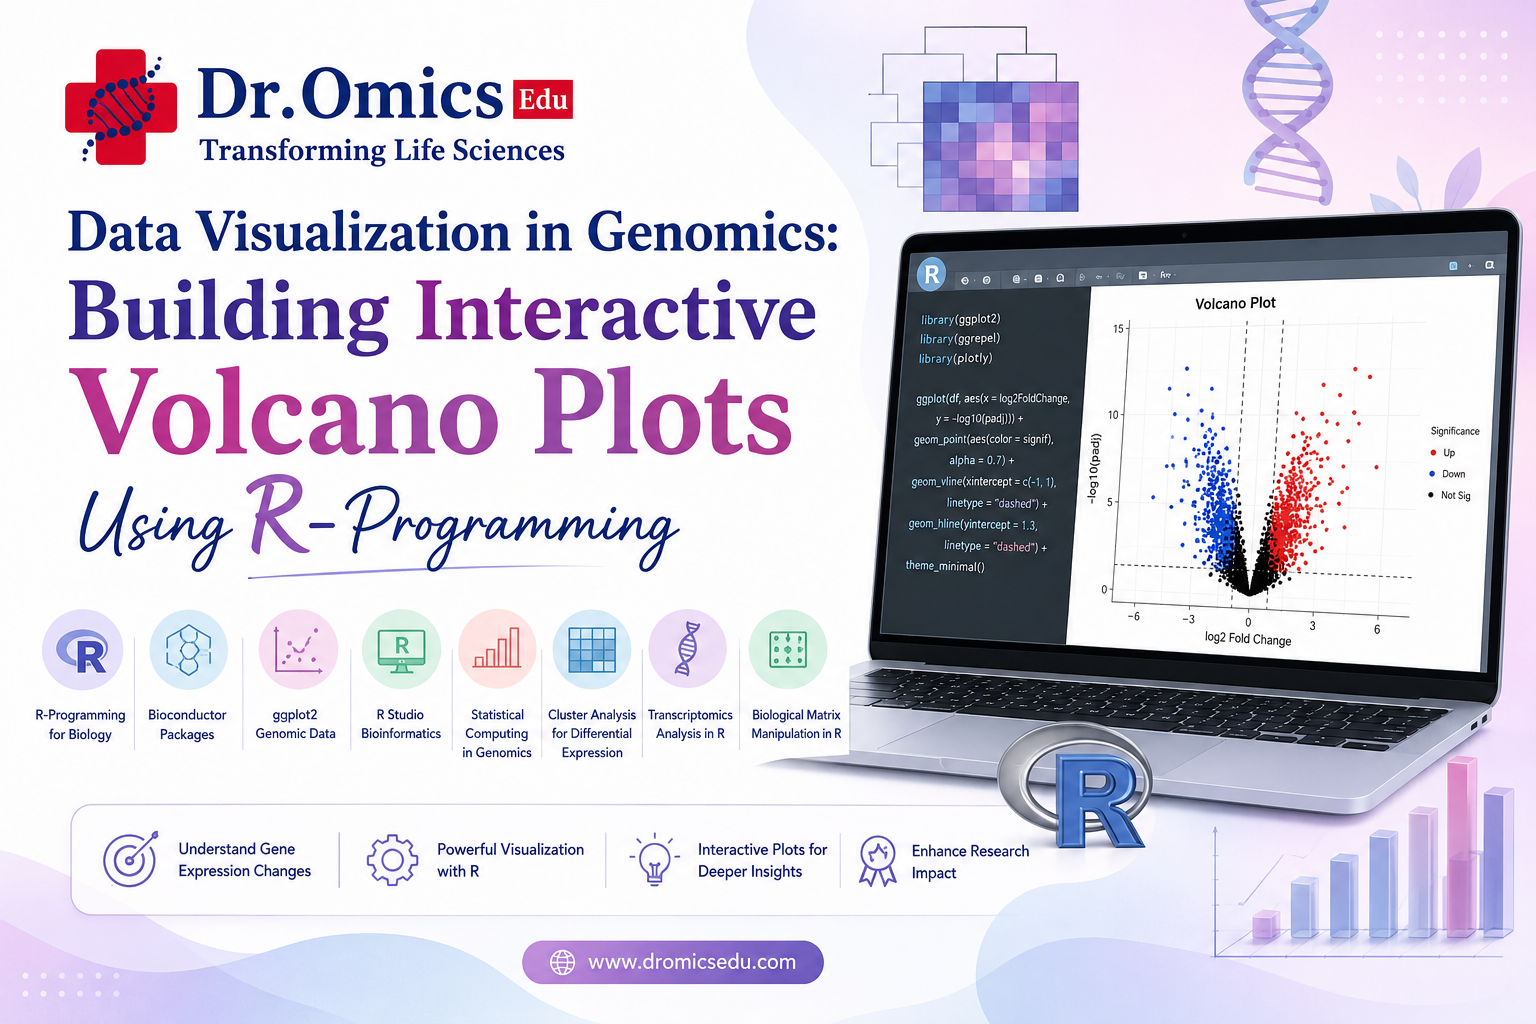
A volcano plot is a scatter plot used to display differential gene expression results.
The horizontal axis represents the log₂ Fold Change, showing whether genes are upregulated or downregulated between two experimental groups.
The vertical axis represents the −log₁₀ p-value, indicating the statistical significance of each gene.
Each point corresponds to a single gene. Genes located in the upper-right corner represent significantly upregulated genes, while those in the upper-left corner represent significantly downregulated genes. Genes near the center generally show little or no significant expression change.
Because volcano plots display both biological significance and statistical confidence simultaneously, they have become one of the most commonly used visualizations in RNA sequencing studies.
Why Use R Programming for Biology?
R-programming for biology has become one of the most important skills in bioinformatics because it combines powerful statistical analysis with flexible visualization tools.
Researchers use R to:
- Analyze RNA-seq data
- Perform differential expression analysis
- Visualize genomic datasets
- Conduct pathway enrichment analysis
- Generate publication-quality figures
- Perform machine learning and statistical modeling
Since R is open-source and supported by a large scientific community, it continues to be one of the most widely used programming languages in genomics.
RStudio Bioinformatics
Although R provides the programming language, RStudio bioinformatics offers an integrated environment that makes coding much easier.
RStudio allows researchers to write scripts, manage projects, visualize plots, install packages, and generate reports within a single interface. Features such as syntax highlighting, package management, interactive plotting, and integrated documentation significantly improve productivity and make genomic analysis more efficient.
For beginners, RStudio provides an organized workspace that simplifies learning R programming.
Bioconductor Packages for Genomic Analysis
One of the biggest strengths of R is the availability of Bioconductor packages, a collection of specialized tools developed specifically for bioinformatics.
Popular Bioconductor packages include:
- DESeq2 for differential gene expression analysis
- edgeR for RNA-seq count analysis
- limma for microarray and RNA-seq analysis
- GenomicRanges for genomic interval analysis
- clusterProfiler for functional enrichment analysis
- AnnotationDbi for gene annotation
These packages work together to create complete transcriptomics workflows, from raw sequencing data to biological interpretation.
Transcriptomics Analysis in R
Transcriptomics analysis in R involves studying gene expression changes between different biological conditions such as healthy versus diseased tissues or treated versus untreated samples.
A typical workflow includes:
- Importing count data
- Data normalization
- Differential expression analysis
- Multiple testing correction
- Volcano plot generation
- Functional enrichment analysis
Packages such as DESeq2 and edgeR automatically calculate fold changes and adjusted p-values, which are then used to construct volcano plots.
Building Interactive Volcano Plots Using ggplot2
One of the most popular visualization libraries in R is ggplot2 genomic data. It allows researchers to create highly customizable volcano plots with publication-quality formatting.
Researchers can customize:
- Point colors
- Gene labels
- Statistical significance thresholds
- Fold-change cutoffs
- Themes and fonts
- Titles and legends
To make volcano plots interactive, packages such as Plotly can be integrated with ggplot2. Interactive plots allow users to zoom, hover over individual genes, search for specific biomarkers, and explore datasets more efficiently.
These interactive visualizations are particularly useful when analyzing thousands of genes.
Statistical Computing in Genomics
Modern genomic studies rely heavily on statistical computing in genomics to identify meaningful biological differences while minimizing false discoveries.
R provides numerous statistical methods including:
- Hypothesis testing
- Regression analysis
- Principal Component Analysis (PCA)
- Hierarchical clustering
- Machine learning
- False Discovery Rate (FDR) correction
These statistical methods ensure that the genes highlighted in volcano plots are both biologically relevant and statistically significant.
Biological Matrix Manipulation in R
Before visualization, sequencing data requires preprocessing through biological matrix manipulation in R.
Gene expression datasets are stored as matrices where rows represent genes and columns represent samples. Researchers typically perform filtering, normalization, data transformation, missing value handling, and metadata integration before statistical analysis.
Packages such as dplyr, tidyr, data.table, and matrixStats simplify these operations, enabling efficient processing of large genomic datasets.
Cluster Analysis for Differential Expression
After identifying significant genes through volcano plots, researchers often perform cluster analysis for differential expression.
Clustering groups genes that share similar expression patterns, helping researchers identify genes involved in common biological pathways or regulatory networks.
Common clustering approaches include:
- Hierarchical clustering
- K-means clustering
- Consensus clustering
- Gene co-expression analysis
Cluster analysis is usually visualized using heatmaps, which complement volcano plots by showing expression patterns across all biological samples.
Advantages of Using R for Genomic Visualization
R has become the preferred platform for genomic visualization because it offers several advantages:
- Open-source and freely available
- Excellent statistical analysis capabilities
- Large collection of Bioconductor packages
- Highly customizable visualizations
- Publication-quality graphics
- Strong community support
- Reproducible workflows
- Integration with machine learning and AI tools
These advantages make R an essential tool for modern bioinformatics research.
Future Scope
As genomic datasets continue to grow, interactive visualization tools are becoming increasingly important. Integration of artificial intelligence, cloud computing, and web-based dashboards is making genomic data analysis faster and more accessible.
Interactive volcano plots combined with machine learning and multi-omics analysis will continue to play an important role in biomarker discovery, personalized medicine, cancer genomics, and precision healthcare.
Learning R-programming for biology today prepares researchers for the future of computational genomics.
Conclusion
Data visualization is an essential step in genomic data analysis, allowing researchers to interpret complex sequencing datasets efficiently. Volcano plots provide a clear overview of differentially expressed genes by combining fold change and statistical significance in a single figure. Using R-programming for biology, researchers can generate interactive and publication-quality volcano plots with the help of ggplot2 genomic data, Bioconductor packages, and RStudio bioinformatics.
When combined with transcriptomics analysis in R, statistical computing in genomics, biological matrix manipulation in R, and cluster analysis for differential expression, volcano plots become a powerful tool for identifying biomarkers, understanding gene regulation, and discovering new biological insights. As bioinformatics continues to evolve, proficiency in R programming and genomic visualization will remain an indispensable skill for researchers working in genomics and life sciences.
