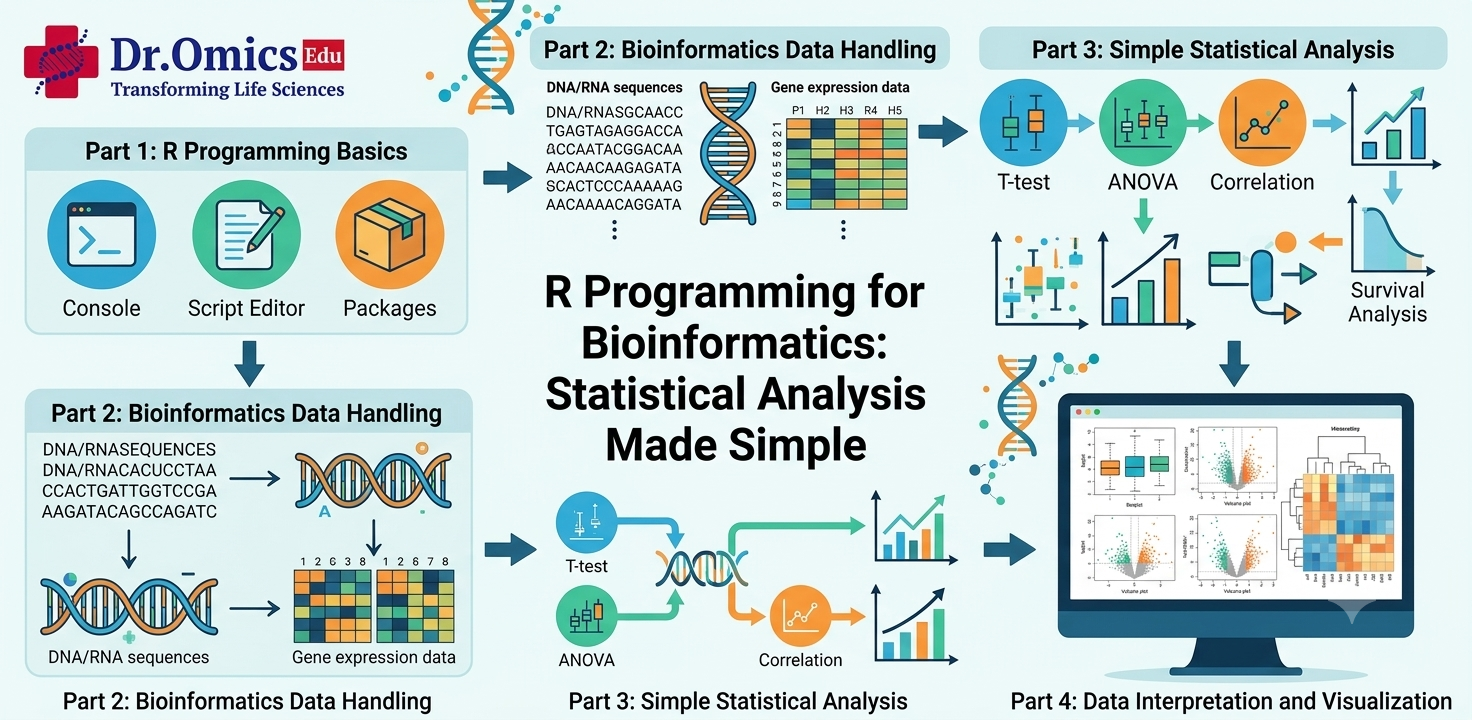
R Programming for Bioinformatics: Statistical Analysis Made Simple
Dr. Omics Edu Team ·
Modern biology generates massive amounts of data from genomics, transcriptomics, clinical research, and other experiments. To understand this data, researchers need tools for statistical analysis, visualization, and data interpretation. This is where R programming for bioinformatics becomes highly valuable.
R is a programming language and statistical computing environment widely used in life sciences for analyzing biological datasets and creating meaningful visualizations.
Why Use R in Bioinformatics?
R makes it easier to explore and analyze complex biological data. With R for biological data analysis, researchers can perform statistical tests, identify patterns, analyze gene expression, and create publication-quality graphs.
R is commonly used for:
- Gene expression analysis
- RNA-seq analysis
- Differential expression
- Statistical testing
- Data visualization
- Clustering and PCA
- Pathway and enrichment analysis
Statistical Analysis in R
One of R's biggest strengths is statistics. Statistical analysis in R can be used to compare experimental groups, identify significant differences, study relationships between variables, and evaluate biological trends.
Common methods include:
- t-test
- ANOVA
- Correlation
- Regression
- PCA
- Clustering
- Differential expression analysis
For example, researchers can use R to identify genes that are significantly upregulated or downregulated between control and treated samples.
R for Gene Expression and RNA-seq
R for gene expression analysis is widely used to analyze thousands of genes across multiple samples. Researchers can generate heatmaps, volcano plots, boxplots, and PCA plots to understand gene expression patterns.
R is also an important component of R for RNA seq analysis. Popular Bioconductor packages such as DESeq2, edgeR, and limma are commonly used for downstream analysis of RNA-seq and gene expression datasets.
What Is Bioconductor?
Bioconductor is an open-source ecosystem of R packages specifically developed for biological data analysis.
A basic Bioconductor tutorial may cover:
Data Import → Preprocessing → Statistical Analysis → Visualization → Biological Interpretation
It provides specialized tools for genomics, transcriptomics, proteomics, and other life-science applications.
R vs Python in Bioinformatics
When comparing R vs Python bioinformatics, both languages are useful but have different strengths.
R is particularly strong in statistics, data analysis, visualization, and genomics packages, while Python is widely used for programming, automation, and bioinformatics pipelines.
For many bioinformatics professionals, knowing both languages provides a strong advantage.
Learn R Programming for Biology
If you want to learn R programming biology, start with basic programming concepts such as variables, vectors, data frames, functions, loops, and data visualization. You can then progress to biological datasets and Bioconductor packages.
A practical R programming course for beginners should connect programming concepts with real-world examples from genomics and life sciences.
R is now an essential skill in many areas of R programming life sciences, including genomics, transcriptomics, clinical research, biostatistics, and drug discovery.
Start Your R Journey
Learning R is more than learning a programming language—it is about developing the ability to analyze biological data, visualize results, and turn complex datasets into meaningful scientific insights.
Learn R. Analyze data. Discover biology.
